Log flows within a Kubernetes cluster: the path of the Logging Operator

Introduction
Managing logs within a Kubernetes Cluster can be challenging, as logs, along with metrics, constitute a fundamental element for gaining a comprehensive understanding and effectively monitoring what is happening within a Kubernetes cluster. To manage logging within a distributed system, we need agents on various nodes that send logs to a centralized system responsible for parsing and cleaning the logs. After the logs have been processed, they are sent for storage and can be queried as needed
The logging Operator significantly simplifies log management in a Kubernetes environment. Here’s why you might consider using it:
Logging Operator
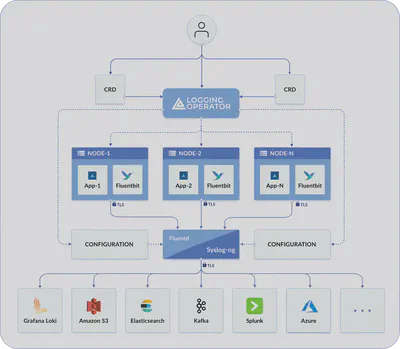
The operator deploys and configures a log collector (currently a Fluent Bit DaemonSet) on every node to collect container and application logs from the node file system.
The log forwarder instance (Fluentd) receives, filters, and transforms the incoming the logs, and transfers them to one or more destination outputs. The Logging operator supports Fluentd and syslog-ng as log forwarders.
Fluentbit is an open-source telemetry agent specifically designed to efficiently handle the challenges of collecting and processing telemetry data across a wide range of environments, from constrained systems to complex cloud infrastructures This component queries the Kubernetes API and enriches the logs with metadata about the pods, and transfers both the logs and the metadata to a log forwarder instance.
Fluentd is an open-source data collector for a unified logging layer. Fluentd allows you to unify data collection and consumption for better use and understanding of data.

Logging CRD
The first Custom Resource Definition (CRD) we discuss is called Logging. This CRD defines the logging infrastructure that will collect and send logs within our Kubernetes cluster. The logging CRD contains configurations for Fluentbit agents, which will be installed as a DaemonSet on each node, and the option to choose between Fluentd and SyslogNG as log forwarders.
Here is an example of a Logging resource within a Kubernetes cluster:
apiVersion: logging.banzaicloud.io/v1beta1
kind: Logging
metadata:
  name: default-logging-simple
  namespace: logging
spec:
  fluentd: {}
  fluentbit: {}
  controlNamespace: logging
  watchNamespaces: ["prod", "test"]
Let’s take a look at the fields in this configuration’s .spec:
fluentd: We are not providing any custom configuration here but choosing Fluentd as the log forwarder.
fluentbit: Similarly, we are not passing any custom configuration here, and Fluentd will be our log collector.
controlNamespaces: The administrative namespace of our Logging Operator.
watchNamespaces: Defines which namespaces the Fluentbit DaemonSet will collect logs from.
Our playground
To play with the Logging Operator, we will use a Kubernetes cluster created with Minikube.
Here is the Makefile to set it up:
kubernetes-version?=v1.25.7
driver?=parallels
memory?=8192
cpu?=4
cni?=calico
nodes?=2

.PHONY: setup
setup: minikube addons

.PHONY: minikube
minikube:
	minikube start \
        --kubernetes-version $(kubernetes-version) \
        --driver $(driver) \
        --memory $(memory) \
        --cpus $(cpu) \
        --cni $(cni) \
        --nodes $(nodes) \
        --embed-certs

.PHONY: addons
addons:
	minikube addons enable metrics-server
	minikube addons enable ingress

.PHONY: delete
delete:
	minikube delete
You just need to run:
make setup
To have your small Kubernetes cluster up and running locally in just a few minutes.
And to install everything you need, we will use Fury by SIGHUP, a Kubernetes extension that provides some pre-built modules. In this case, we will use the modules for logging, monitoring, and ingress. There are other modules available that you can use. Here is a complete list of all modules and their latest versions.
With this basic installation, you bring into the cluster:
- Opensearch
- Opensearch Dashboard
- Minio
- Logging Operator (Fluentd + Fluentbit)
- Prometheus
- Grafana
“For simplicity, I have created a repository that you can clone, and it already contains everything we need.
You can clone it using the command
git clone https://github.com/ettoreciarcia/blog-example.git
The manifests you see in there are the result of downloading the modules with furyctl after defining the Furyfile.yml.
If you’re curious to try furyctl, you can find all the references at this link :)
Instead, if you want to install only the logging operator, you can do so using Helm
helm upgrade --install --wait --create-namespace --namespace logging logging-operator oci://ghcr.io/kube-logging/helm-charts/logging-operator
First scenario: logs from a pod to OpenSearch
For our demo, we will use a test container that prints logs to standard output.
We have already deployed the OpenSearch cluster using the manifests downloaded with furyctl, so we have the endpoint to contact for sending logs.
Let’s proceed to create our pod::
apiVersion: apps/v1
kind: Deployment
metadata:
  name: random-logger-deployment
spec:
  replicas: 1
  selector:
    matchLabels:
      app: random-logger
  template:
    metadata:
      labels:
        app: random-logger
    spec:
      containers:
      - name: random-logger
        image: chentex/random-logger:latest
        ports:
        - containerPort: 80
The nature of the container is not of much concern. The important thing is that it has logs to print to standard output, you can use any container of your choice for the demo.
Currently, the logs are simply printed to the standard output of that container, we are not managing or centralizing them in OpenSearch.
To take a look at the logs that the container prints to standard output, we can use the command
kubectl logs [POD_NAME] -n random-logger
You should get an output similar to this
2023-12-08T23:19:27+0000 WARN A warning that should be ignored is usually at this level and should be actionable.
2023-12-08T23:19:31+0000 ERROR An error is usually an exception that has been caught and not handled.
2023-12-08T23:19:33+0000 WARN A warning that should be ignored is usually at this level and should be actionable.
2023-12-08T23:19:34+0000 WARN A warning that should be ignored is usually at this level and should be actionable.
2023-12-08T23:19:38+0000 DEBUG This is a debug log that shows a log that can be ignored.
2023-12-08T23:19:40+0000 ERROR An error is usually an exception that has been caught and not handled.
2023-12-08T23:19:45+0000 WARN A warning that should be ignored is usually at this level and should be actionable.
2023-12-08T23:19:46+0000 ERROR An error is usually an exception that has been caught and not handled.
2023-12-08T23:19:51+0000 WARN A warning that should be ignored is usually at this level and should be actionable.
2023-12-08T23:19:52+0000 INFO This is less important than debug log and is often used to provide context in the current task.
2023-12-08T23:19:55+0000 DEBUG This is a debug log that shows a log that can be ignored.
The logs are currently already present in the kubernetes-* index as the Fury logging module automatically indexes them in Elasticsearch with the Flow and Output defined within the vendor folder.
But let’s take an additional step and send the logs from our container to another index within Elasticsearch using the Logging Operator.
Output
Outputs are the destinations where your log forwarder sends the log messages, for example, to Sumo Logic, or to a file. Depending on which log forwarder you use, you have to configure different custom resource
The Output resource defines an output where your Fluentd Flows can send the log messages. The output is a namespaced resource which means only a Flow within the same namespace can access it. You can use secrets in these definitions, but they must also be in the same namespace. Outputs are the final stage for a logging flow. You can define multiple outputs and attach them to multiple flows.
So, let’s go ahead and create an Output (a Custom Resource Definition installed with the Logging Operator)
apiVersion: logging.banzaicloud.io/v1beta1
kind: Output
metadata:
  name: random-log
  namespace: random-logger
spec:
  opensearch:
    host: opensearch-cluster-master.logging.svc.cluster.local
    port: 9200
    scheme: http
    logstash_format: true
    logstash_prefix: random-log
    request_timeout: 600s
    template_overwrite: true
    template_name: random-log
    template_file:
      mountFrom:
        secretKeyRef:
          name: random-log-index-template
          key: random-log-index-template
    log_os_400_reason: true
    ssl_verify: false
    suppress_type_name: true
    buffer:
      timekey: "1m"
      timekey_wait: "10s"
      timekey_use_utc: true
      chunk_limit_size: "2m"
      retry_max_interval: "30"
      retry_forever: true
      overflow_action: "block"
And let’s analyze the .spec field that we are passing to this configuration:
- .opensearch si riferisce alla congigurazione del nostro cluster Opensearch su cui andremo a pushare
As for the buffer, I believe it’s worth spending a few more words because it’s something that I had initially underestimated
How buffer works in fluentd
Let’s take our example: we are sending logs from a container to OpenSearch using Fluentbit and Fluentd.
Before reaching OpenSearch, the logs are temporarily stored in a Fluentd buffer, from where they will then be transmitted
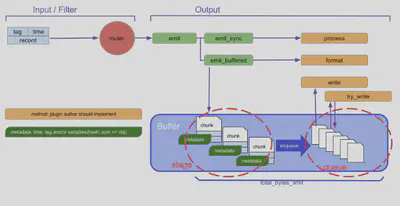
A buffer is essentially a set of “chunks”. A chunk is a collection of events concatenated into a single blob. Each chunk is managed one by one in the form of files (buf_file) or continuous memory blocks (buf_memory)
The Lifecycle of Chunks
You can think of a chunk as a cargo box. A buffer plugin uses a chunk as a lightweight container, and fills it with events incoming from input sources. If a chunk becomes full, then it gets “shipped” to the destination.
Internally, a buffer plugin has two separated places to store its chunks: “stage” where chunks get filled with events, and “queue” where chunks wait before the transportation. Every newly-created chunk starts from stage, then proceeds to queue in time (and subsequently gets transferred to the destination).

- .buffer:
- .timekey: if this parameters is specified, the output plugin writes events into chunks grouped by time key
- .timekey_wait: this parameter configures the flush delay for events
- .timekey_use_utc: Output plugin decides to use UTC or not to format placeholders using timekey
- .chunk_limit_size: The max size of each chunks: events will be written into chunks until the size of chunks become this size
- .retry_max_interval: The maximum interval (seconds) for exponential backoff between retries while failing
- .retry_forever: If true, plugin will ignore retry_timeout and retry_max_times options and retry flushing forever
- .overflow_action: how does output plugin behave when its buffer queue is full? In our case wait until buffer can store more data. After buffer is ready for storing more data, writing buffer is retried. Because of such behavior, block is suitable for processing batch execution, so do not use for improving processing throughput or performance.
Flow
The first thing to do is to define a Flow, a new object in Kubernetes installed through the Custom Resource Definitions of the Logging Operator.
Flow defines a logging flow for Fluentd with filters and outputs.
The Flow is a namespaced resource, so only logs from the same namespaces are collected. You can specify match statements to select or exclude logs according to Kubernetes labels, container and host names. (Match statements are evaluated in the order they are defined and processed only until the first matching select or exclude rule applies.) For detailed examples on using the match statement, see log routing
At the end of the Flow, you can attach one or more outputs, which may also be Output or ClusterOutput resources.
We can define a new Flow object like this:
apiVersion: logging.banzaicloud.io/v1beta1
kind: Flow
metadata:
  name: random-log-flow
  namespace: random-logger
spec:
  filters:
    - dedot:
        de_dot_separator: "_"
        de_dot_nested: true
    - parser:
        key_name: message
        parse:
          type: json
        remove_key_name_field: true
        reserve_data: true
        emit_invalid_record_to_error: false
  match:
    - select:
        labels:
          app: random-logger
  localOutputRefs:
    - random-log
Esattamente come l’Output, anche il Flow è una risorsa di tipo namespaced all’interno del cluster Kubernetes-
Entriamo nel dettaglio di questa configurazione
At this point, the logs have been collected by Fluentbit, pushed to Fluentd, and then reached OpenSearch, where they have been indexed.
We can verify that our logs have arrived correctly at the output we defined earlier using the OpenSearch Dashboard.
To connect to the OpenSearch Dashboard, we have two options
- Enable port forwarding for the OpenSearch Dashboard service:
kubectl port-forward svc/opensearch-dashboards 5601 -n logging
and then we visite the page http://localhost:5601
- We use the nginx Ingress controller deployed within our cluster and the Ingress rules we added to the manifest to reach the OpenSearch Dashboard. To do this, we need to get the Minikube IP address with
minikube ipand use the output to add a line to the/etc/hostsfile on our client
<MINIKUBE_IP_OUTPUT> kibana.fury.info
