Homepage: a single pain of glass for your Homelab
A Quick Update
I’ve started writing technical articles for an Italian YouTube channel with over 100,000 subscribers.
Naturally, the channel focuses on the Open Source world, and I think I’ll mainly be writing articles about homelabs and the Cloud Native Computing Foundation landscape.
So here’s the first video I contributed to!

How Hard Is It to Manage a Homelab With Too Many Endpoints?
Managing a homelab is more complex than it seems. Think about it: NAS, Plex Server, Portainer, Grafana, Home Assistant, Pi-hole… and every service has its own IP, port, and web interface!
At first, everything’s fine. You remember it all by heart. Then you add a few VMs, a dozen containers, and suddenly you’re chasing 20 URLs.
Moral of the story: the bigger your homelab gets, the more essential it becomes to have a centralized access point for organizing and reaching all your services.
What Is Homepage?
What if I told you there’s a tool built exactly to solve this problem?
It’s called Homepage: a minimal, open-source, fully customizable dashboard.
But it’s not just a list of links. Homepage can monitor container statuses, display real-time stats, categorize your apps, and integrate dynamic data.
The best part? It’s all configured via a simple YAML file.
Let’s see how to configure Homepage in your homelab.
Demo
Setting Up Homepage in Docker
In your terminal, run:
mkdir homepage
cd homepage
mkdir homepage-data
Let’s use a standard docker-compose setup:
services:
  homepage:
    image: ghcr.io/gethomepage/homepage:latest
    container_name: homepage
    environment:
      HOMEPAGE_ALLOWED_HOSTS: "*"
    ports:
      - 3000:3000
    volumes:
      - ./homepage-data:/app/config
      - /var/run/docker.sock:/var/run/docker.sock:ro
    restart: unless-stopped
Now just run
docker compose up -d
To start your Homepage container!
You can confirm it’s running:
root@homepage:/home/hecha/homepage# docker ps
CONTAINER ID   IMAGE                                 COMMAND                  CREATED          STATUS                    PORTS                                         NAMES
beadcccb8d75   ghcr.io/gethomepage/homepage:latest   "docker-entrypoint.s…"   54 seconds ago   Up 52 seconds (healthy)   0.0.0.0:3000->3000/tcp, [::]:3000->3000/tcp   homepage
Now access Homepage at port 3000
Customizations
Example 1: Change the Dashboard Title
cd homepage-data
vi settings.yaml
---
# For configuration options and examples, please see:
# https://gethomepage.dev/latest/configs/settings


title: "Morro's dashboard"

providers:
  openweathermap: openweathermapapikey
  weatherapi: weatherapiapikey
More customization examples can be found at this link
Example 2: Background Image
Add this line to settings.yaml
background: https://images.unsplash.com/photo-1502790671504-542ad42d5189?auto=format&fit=crop&w=2560&q=80
to the file settings.yaml
and we get
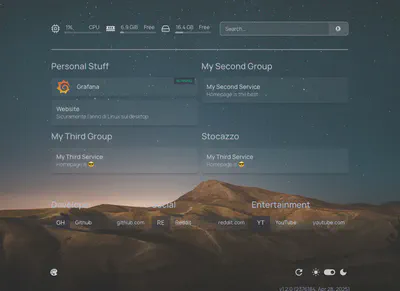
Example 3: Background Opacity and Filters
background:
  image: https://images.unsplash.com/photo-1502790671504-542ad42d5189?auto=format&fit=crop&w=2560&q=80
  blur: xl
  saturate: 50
  brightness: 25
  opacity: 40
Example 4: How to add a service manually
Want to modify the list of accessible services?
vi services.yaml
# For configuration options and examples, please see:
# https://gethomepage.dev/configs/services/
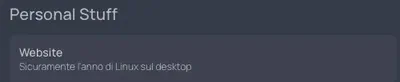
- Personal Stuff:
- Website:
href: https://morrolinux.it
description: "Sicuramente l'anno di Linux sul desktop"
- My Second Group:
- My Second Service:
href: http://localhost/
description: Homepage is the best
- My Third Group:
- My Third Service:
href: http://localhost/
description: Homepage is 😎
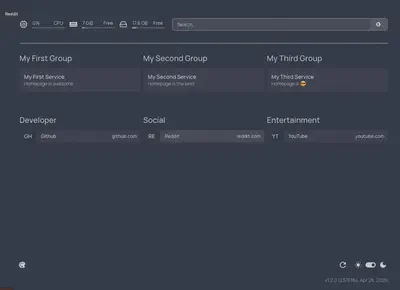
Result:
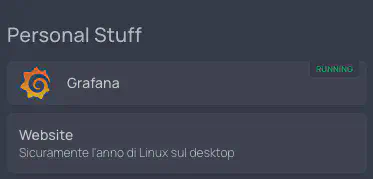
Autodiscovery via container’s labels
So far, these are features that every launcher has.
But where Homepage really shines is in the autodiscovery of our containers via annotations.
services:

  grafana:
      image: grafana/grafana:latest
      container_name: grafana
      ports:
        - "3001:3000"
      volumes:
        - grafana-storage:/var/lib/grafana
      environment:
        - GF_SECURITY_ADMIN_USER=morrolinux
        - GF_SECURITY_ADMIN_PASSWORD=linuxmorro
      labels:
        - homepage.group=Personal Stuff        #annotazioni da aggiungere
        - homepage.name=Grafana                #annotazioni da aggiungere
        - homepage.icon=grafana                #annotazioni da aggiungere
        - homepage.href=http://localhost:3001  #annotazioni da aggiungere
      restart: unless-stopped

volumes:
  grafana-storage:
This works because Homepage has read access to the Docker socket.
You’ll also need to enable the Docker provider in docker.yaml:
---
# For configuration options and examples, please see:
# https://gethomepage.dev/configs/docker/

# my-docker:
#   host: 127.0.0.1
#   port: 2375

my-docker:
  socket: /var/run/docker.sock
Let’s add this label to our container
For testing porpose I’m using a container running Grafana
docker compose -f grafana-compose.yaml up -d
root@homepage:/home/hecha/homepage# docker ps
CONTAINER ID   IMAGE                                 COMMAND                  CREATED         STATUS                    PORTS                                         NAMES
126a7276ff7e   grafana/grafana:latest                "/run.sh"                3 seconds ago   Up 2 seconds              0.0.0.0:3001->3000/tcp, [::]:3001->3000/tcp   grafana
3fa9d42e18f1   ghcr.io/gethomepage/homepage:latest   "docker-entrypoint.s…"   42 hours ago    Up 12 minutes (healthy)   0.0.0.0:3000->3000/tcp, [::]:3000->3000/tcp   homepage
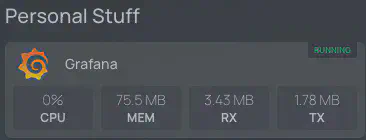
Container stats
By adding the following line to your settings.yaml file
showStats: true
you’ll be able to view the resource usage of individual containers.
Cool Feature: Widgets
You might be thinking, “Yeah Morro, yet another dashboard that lets us click on our services from a single panel.”
But here’s the coolest part: Widgets.
We’re not just talking about colorful buttons, Homepage supports dynamic widgets that can:
- Give you an overview of your Proxmox cluster
- Show how many queries Pi-hole is filtering
- Monitor the status of your Docker stack
You can find the full list of currently available widgets at this link.
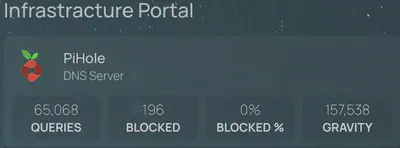
Widget Customization Example: Pi-hole
Let’s take a look at an example using a widget like Pi-hole
    - PiHole:
        href: http://dns.internal.ettoreciarcia.com:8085/admin
        icon: pi-hole.png
        description: DNS Server
        widget:
            type: pihole
            url: http://pihole:80
            key: eheh voleviii
[oscura il tuo token lol]
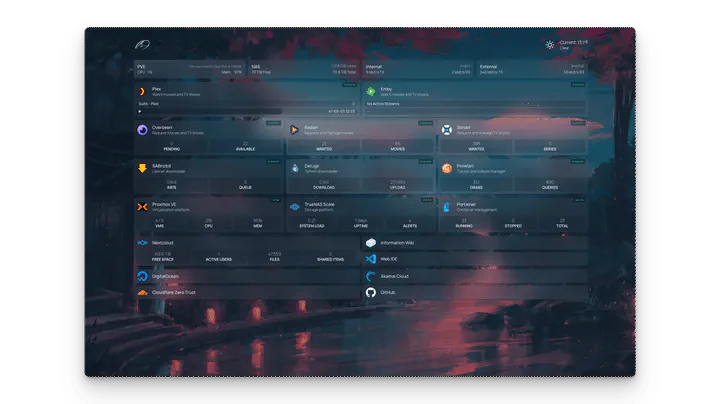
The final result looks like this:
Setting Up Homepage with Kubernetes
You already have a Kubernetes cluster and you’re thinking: “Nice, but I don’t use Docker Compose anymore, it’s outdated! I use Kubernetes.”
You’ll need the following:
- A metrics server (included by default in RKE2)
- An Ingress Controller (I’m using nginx, also included by default in RKE2)
on ⛵ default () morrolinux/homepage-docker-k8s on develop [!⇡] ❯ k get nodes
NAME STATUS ROLES AGE VERSION
rke2-naked Ready control-plane,etcd,master 3m34s v1.32.4+rke2r1
Steps:
- Create a ServiceAccount for Homepage
- Create a secret for the SA
- Create the configmap with our Homepage config
- Create ClusterRole and Binding
- Deploy Homepage
- Expose via Service
- Publish via Ingress
We can now apply our manifests:
k apply -f kubernetes/manifests.yaml
serviceaccount/homepage created
secret/homepage created
configmap/homepage created
clusterrole.rbac.authorization.k8s.io/homepage created
clusterrolebinding.rbac.authorization.k8s.io/homepage created
deployment.apps/homepage created
service/homepage created
ingress.networking.k8s.io/homepage created
Anche check if our Deployment is ok:
on ⛵ default () homepage-docker-k8s/kubernetes on develop [!?⇡] ❯ k get pods
NAME READY STATUS RESTARTS AGE
homepage-664fd549d4-p449p 1/1 Running 0 2m50s
Per visualizzare la nostra dashboard

### Autodiscovery via labels in Kubernetes
Once again, we can use the autodiscovery feature, just like in Docker, this time using annotations on new Ingress resources.
This time I won’t share the configuration files as usual! You can find them on MorroLinux’s Patreon!
on ⛵ default () homepage-docker-k8s/kubernetes on develop [!?⇡] ❯ k apply -f test.yaml
namespace/hello-world created
deployment.apps/nginx-deployment created
service/nginx-service created
ingress.networking.k8s.io/nginx-ingress created
Verifichiamo il nuovo ingress
on ⛵ default () homepage-docker-k8s/kubernetes on develop [!?⇡] ❯ k get ingress -A
NAMESPACE NAME CLASS HOSTS ADDRESS PORTS AGE
default homepage nginx homepage.morrolinux.it 192.168.0.32 80 16m
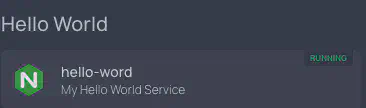
hello-world nginx-ingress nginx hello-world.morrolinux.it 192.168.0.32 80 2m2s
Thanks to the annotations configured on the Ingress, you should also see this endpoint show up in Homepage: